
|
Top Rated by Users
Boost profits by utilizing analytics & sales
Analyze sales, user trends seamlessly in one solution.
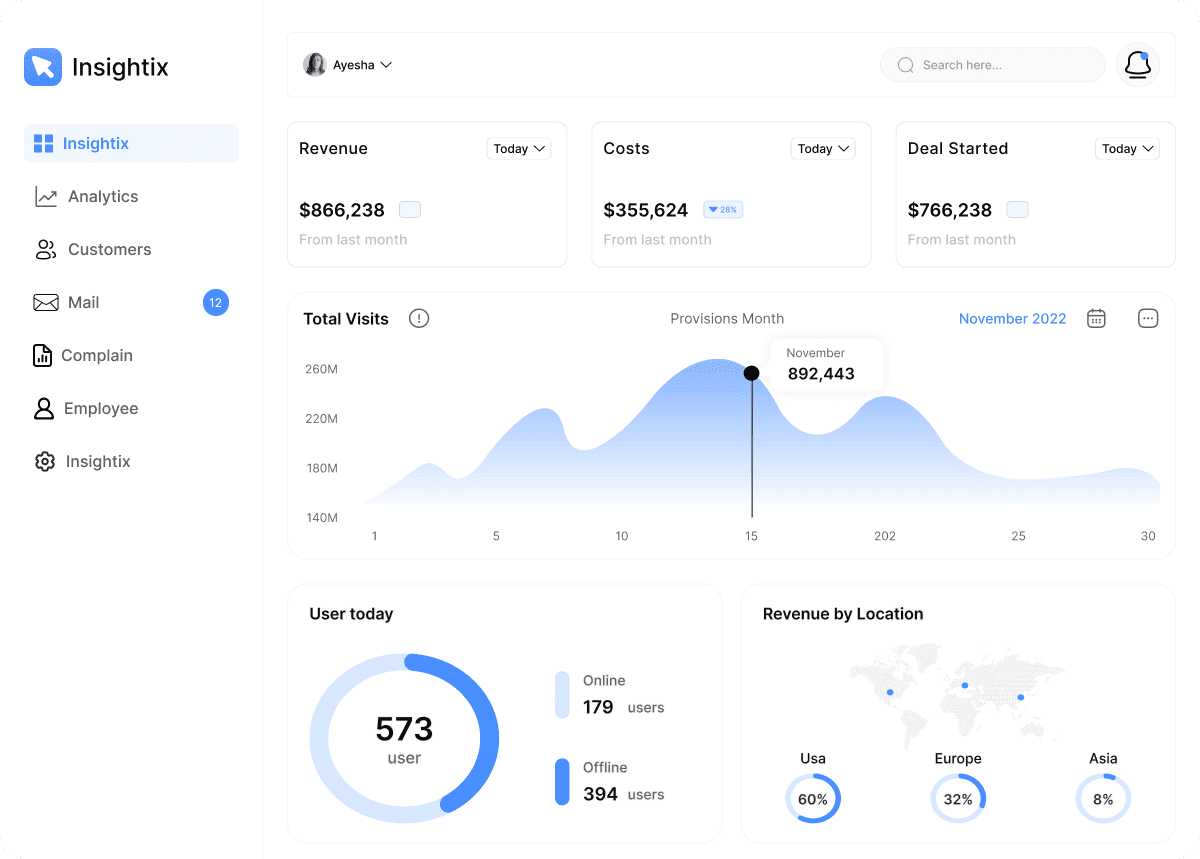
- All Your Data in One PlaceERP · CRM · Excel · marketplace · SQL
- Real-Time DashboardsLive data · automatic refresh
- KVKK & Data SecurityRole-based access · audit log
- Cloud-BasedNo installation · always up to date
Turn

sales
confusion to
clarity
with

smart
tools
Integration

Framer

Blogger

Mail Chimp

Trello
Third-party integrations
Connect with various apps to consolidate data and streamline workflows

Work Hour Analysis
Details
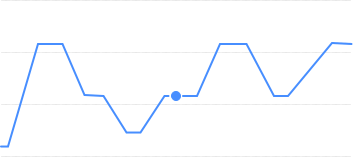
Monday, 6h
Real-Time Data
Access dynamic dashboards that show live data insights

Generate

Automated Reporting
Generate reports automatically, saving time and ensuring consistent data
Features
Powerful features to boost your analytics

Sales Tracking
Monitor sales performance in real-time to quickly identify trends

Sales Dashboards
Build personalized dashboards that highlight the metrics

Performance Reports
Generate and share reports automatically, ensuring your team

Lead Scoring
Prioritize high-potential leads based on data-driven scoring

Analytics for Growth
Leverage predictive insights to anticipate sales and make data

Customer Insights
Gain deep insights into customer behavior, purchase patterns
How it works
Seamless efficient journey to achieve your goals



Step-01
Create account
Create your account and connect your data sources in minutes. Start your journey toward smarter sales and analytics.

Create Account
Step-02
Track and check
Monitor real-time metrics and performance data, all in one place. Easily track progress and key indicators for sales success.

Total Visitors
8,261
3%

1,373 visitors today
Desktop (1440x1024)
268 visitors
Desktop (1280x832)
349 visitors
Step-03
Analyze Performance
Dive deep into insights with powerful analytics tools. Uncover patterns, forecast results, and make data-driven decisions with ease.
Analyze Performance
856
+5.89%

Jul
Aug
Sep
Oct
Nov
Everything, in one list.
Every capability this product covers — by category, in one list.
Blesyum ERP & Pre-Accounting connection · CRM and sales-data integration · Excel & Google Sheets import · SQL database connection (MySQL, PostgreSQL, MSSQL) · Marketplace & e-commerce data (Trendyol, Hepsiburada) · Data pull via open API · Automatic data refresh & scheduling · Blend multiple sources into one model · Web analytics & ad-platform connection
Ready-made industry dashboards · Drag-and-drop dashboard designer · 30+ chart and visual types · Interactive filters & slicers · Drill-down · Conditional formatting & alert colors · Mobile-friendly dashboards · Full-screen / TV (kiosk) view
Ready management reports · Custom report designer · Scheduled automatic reports · Report distribution by email · PDF / Excel / CSV export · Report subscriptions · Paginated (print-ready) reports · Report templates & branding
Pivot and cross-tab analysis · Trend & period-over-period comparison · KPI & target-vs-actual tracking · Segmentation & grouping · Ranking & top-N analysis · Calculated metrics & ratios · Date-based analysis (YTD, MTD, quarter) · Automatic insight summaries
Sales & demand forecasting · Anomaly & deviation detection · Natural-language querying (ask & learn) · What-if scenarios · Cohort & retention analysis · Automatic insight & recommendation engine · Data-driven predictive models
Sales performance & revenue analysis · Sales funnel & pipeline analysis · Lead scoring · Campaign & channel analytics · Customer behavior & insights · Product & category profitability · Sales by region & rep · Return & cancellation analysis
Income-expense & P&L statement · Cash-flow analysis · Budget vs actual comparison · Profitability (product / project / department) · Stock & inventory analytics · Production & efficiency analysis · Receivables-payables aging · Cost analysis
Visual data model & relationships · Calculated fields & measures · Data transformation & prep (ETL) · Data dictionary & metadata · Data quality & cleansing · Historical data & version retention · Single source of truth (unified data layer) · Data refresh logs
Dashboard & report sharing · Comments & annotations · Workspaces & folders · Public / private share links · Favorites & personal views · Notifications & alert thresholds · Team roles & sharing permissions
Role-based access permissions · Row-level security (RLS) · Single sign-on (SSO) · Two-factor authentication (2FA) · Audit log · KVKK-compliant data management · Data masking · Permission & approval flows
Embedded dashboards (iframe / SDK) · White-label · Open REST API · Webhooks & automation triggers · Custom theme & brand identity · Portal & app integration · Developer documentation
Cloud-based, no installation needed · Mobile app (iOS & Android) · Automatic backups & high availability · Setup & data-connection support · Training & onboarding · Local Turkish support · Priority support & SLA (top tier) · Multiple users & workspaces · Continuously updated cloud version
Frequently asked questions about business intelligence
Everything you need to know about Blesyum Business Intelligence & Reporting — from data sources and integrations to dashboards, security, setup and support. Can't find your answer? Get in touch and our team will get back to you shortly.
What exactly is Blesyum Business Intelligence and how is it different from reporting in Excel?
Blesyum Business Intelligence & Reporting is a cloud-based BI software that gathers your data from different systems into a single platform and turns it into real-time dashboards, reports and insights. Unlike classic reporting where you collect data, build formulas and copy-paste every month in Excel, dashboards stay connected to your data source and update themselves automatically. You save time and avoid the inconsistency and human-error risk of scattered files.
Which data sources can it connect to?
Blesyum BI is designed to connect to many sources — primarily Blesyum ERP and Pre-Accounting, plus CRM, Excel and Google Sheets, SQL databases (MySQL, PostgreSQL, MSSQL), marketplace and e-commerce platforms (Trendyol, Hepsiburada, etc.) and web/ad analytics. It blends multiple sources into a single data model, and we can build any custom connection you need via an open API. We can confirm the active connection list and fit for your systems in an initial call.
Does it work integrated with Blesyum ERP, CRM and other Blesyum products?
Yes. Blesyum BI works integrated on the same data as other Blesyum products (ERP, CRM, Pre-Accounting & Finance, e-Transformation). Whichever products you own, we connect their data straight into BI; your sales, stock, finance and customer data meet on one dashboard. Each is a standalone product, but because they unify on one data layer, you never enter the same information twice or face disconnects between reports.
Can I build my own dashboards and reports without writing code?
Yes. With the drag-and-drop dashboard designer you can build your own dashboards without technical knowledge — pick the chart type, add filters and slicers. You start fast with ready-made industry dashboards, then customize as needed. For more advanced scenarios you can define calculated fields and custom metrics; for complex setups, our consultant team is by your side.
How often is the data refreshed — is it real-time?
You set the refresh frequency: several times a day, hourly, or near-instant if the source supports it. With automatic refresh scheduling, dashboards stay current in the background, so you see the latest figures when you open the screen. Sources with a live connection are very close to real-time; sources fed by periodic transfers are current at the interval you choose.
Can I automatically email reports to my team?
Yes. With scheduled reports and report subscriptions you can automatically email selected dashboards or reports to chosen people — for example, a sales summary every morning, a weekly performance report every Monday. Reports can be delivered as PDF or Excel. No one has to prepare reports manually, and everyone gets up-to-date figures on time.
Can I export my data as PDF, Excel or CSV?
Yes. You can export your dashboards and reports as PDF, Excel and CSV; you can also produce print-ready (paginated) reports for presentations, management meetings or sharing with your accountant. Exported files can be templated to your brand identity.
Are there AI-assisted analysis and forecasting features?
Yes. Blesyum BI offers AI-assisted analytics such as sales and demand forecasting, anomaly and deviation detection, natural-language querying (ask your data a question and get an answer) and what-if scenarios. So you answer not only 'what happened?' but also 'why did it happen?' and 'what might happen next?' with data. Advanced analytics features are included in higher tiers.
Can I track KPIs and targets live and get alerts on deviations?
Yes. You track KPIs and targets live on dashboards and see target-vs-actual instantly. Conditional formatting colors critical values; by defining alert thresholds you can be notified when a metric crosses a limit you set. You spot problems the moment they occur, without waiting for the end of a report.
Can I ensure different employees only see the data they're authorized for?
Yes. With role-based access permissions you decide which dashboards and reports each user sees. With row-level security (RLS), two people opening the same dashboard each see only the data they're authorized for — for example, a regional manager sees only their region's figures. Data masking can hide sensitive fields, and an audit log records who accessed what.
Is Blesyum BI KVKK-compliant and how is my data secured?
Yes. Blesyum BI is designed with KVKK requirements in mind; access is limited by role and permission, and activity is recorded in an audit log. Your data is protected with encryption in transit (TLS/SSL) and at rest, and backed up automatically at regular intervals. Features like row-level security, data masking and two-factor authentication (2FA) meet enterprise security requirements.
Can I view dashboards on a mobile device?
Yes. Dashboards are mobile-friendly; you can access them from phone and tablet and track your figures anywhere with the iOS and Android apps. Field teams and executives reach up-to-date data even when out of the office. You can also broadcast dashboards continuously on office screens with the full-screen / TV (kiosk) view.
Can we embed dashboards into our website or app (embedded analytics)?
Yes. With embedded analytics you can embed dashboards into your own website, customer portal or app via iframe or SDK. With the white-label option you can present dashboards under your own brand, and connect to your systems with an open REST API and webhooks. These features are typically included in the Enterprise tier and Premium solutions.
How long does setup take — is connecting my own data hard?
Because it's cloud-based, burdens like server setup and license management disappear; you start using it directly. Connecting your data sources usually takes minutes; for our own products like Blesyum ERP/CRM the connection is ready out of the box. For more complex sources or setups needing a custom data model, we provide setup and data-connection support and build your first dashboards with you.
Can my team learn to use it easily — do you provide training?
Yes. The interface is designed for non-technical users; you start with ready-made dashboards and build your own views with drag-and-drop. During onboarding we provide training for your team; with role-based training, everyone learns only the parts they'll use. Our local Turkish support team is there whenever you need it.
Can it connect to my SQL database or another program?
Yes. It can connect to common SQL databases such as MySQL, PostgreSQL and MSSQL, and we can also pull data from other programs via an open API. We take your data where it lives and blend it in the BI layer; in most cases you don't need to change your existing systems. We assess any custom-source connection need in an initial call.
Can I compare multiple companies, branches or regions on one dashboard?
Yes. You can combine multi-company, multi-branch and multi-region structures into a single data model and build comparative dashboards. You break figures down by region, branch, product, department or rep and see best and worst performers at a glance. A consolidated view shows the whole group's total; drilling down reveals a single unit's numbers.
Which sectors and sizes is it suitable for?
Blesyum BI suits businesses of every size that want to make data-driven decisions: from e-commerce and retail to manufacturing, services and wholesale & distribution. You can start small with ready-made dashboards and scale on the same system with enterprise features such as advanced analytics, embedded analytics and row-level security as you grow.
Is it cloud-only, or is there an on-premise option too?
Blesyum BI is primarily a cloud-based platform; we take installation, maintenance, updates and backups off your hands and keep you on an always-current, secure version. For businesses that need on-premise or private hosting due to corporate policies or sector requirements, we can evaluate options together within Premium solutions during an initial call.
How does pricing work?
Blesyum BI is offered in packages that scale to your needs — Starter, Professional and Enterprise — with Premium solutions for large and custom requirements. The number of data sources, user count and advanced analytics features vary by package. Your exact, tailored price is shaped by your user count, the sources you want to connect and the features you need. Review the packages and click 'Get a Price' to receive a tailored quote in minutes.
Can I get it together with other Blesyum products in one package?
Yes. You can get Business Intelligence together with other Blesyum products such as CRM, ERP and Pre-Accounting under a single contract (Blesyum Suite). Each is a standalone product but works integrated on one data layer: one setup, one team, one invoice and an advantageous total. We determine which products you need together and connect BI to their data.
I have a question I couldn't find an answer to — how do I get in touch?
You can reach us via the 'Get a Price' or 'Contact Us' buttons on the page; just fill in a short form and our team will call you shortly. We listen to your needs, clarify the data-source connection and package recommendation suited to your systems, and share a detailed product presentation if you'd like.
Download the Business Intelligence presentation.
Get the detailed product presentation — dashboards, reports, data-source integrations and example setups — as a PDF you can easily share with your team.
Browse our other products.
Explore the rest of the Blesyum family — add what you need; they all connect to each other.
Blesyum Business Intelligence & Reporting: cloud BI, dashboard and reporting software
What is business intelligence (BI) software?
BI software is a cloud-based application that gathers data scattered across spreadsheets and different programs into a single platform and turns it into meaningful dashboards, reports and insights. With Blesyum Business Intelligence & Reporting you combine data from ERP, CRM, Excel, e-commerce and your databases, and see your entire business on one screen through real-time dashboards. Reporting that takes hours in Excel becomes dashboards that update themselves.
What can you do with a cloud BI program?
With Blesyum BI you can analyze sales, finance, inventory and marketing data in one place; build your own dashboards with a drag-and-drop designer; and distribute scheduled reports automatically by email. You track KPIs and targets live and spot trends and deviations instantly. With AI-assisted features such as natural-language querying and forecasting, you can answer 'what will happen next month?' with data.
Reporting and dashboard program
Blesyum Business Intelligence works as a powerful reporting program: it offers ready management reports, a custom report designer, paginated print-ready reports and PDF/Excel/CSV export. Summary dashboards for executives and operational reports for teams come together on one platform. With report subscriptions, the right people automatically get up-to-date figures every morning — no one wastes time preparing reports manually.
Which data sources does it connect to?
Blesyum BI connects to many sources, primarily Blesyum ERP and Pre-Accounting, plus CRM, Excel and Google Sheets, SQL databases (MySQL, PostgreSQL, MSSQL), marketplace and e-commerce platforms, and web/ad analytics. It blends data into a single model and keeps it current with automatic refresh scheduling. This removes disconnects between figures in different systems — everyone looks at the same single source of truth.
Which sectors and sizes does it fit?
Blesyum Business Intelligence suits businesses of every size that want to make data-driven decisions: from e-commerce and retail to manufacturing, services and wholesale & distribution. You start small with ready-made dashboards and scale with enterprise features such as advanced analytics, embedded analytics and row-level security as you grow. Thanks to its KVKK-compliant, cloud-based infrastructure, you use it without installation or maintenance overhead.
Why Blesyum Business Intelligence & Reporting?
Because it works integrated on the same data as other Blesyum products (ERP, CRM, Pre-Accounting, e-Transformation) — you don't fight to move data from one place to another. With local, KVKK-compliant infrastructure, local Turkish support, setup and training help, and a continuously updated cloud system, Blesyum Business Intelligence stands by you as you grow. Get in touch for a tailored price and a detailed product presentation.